Tuesday, January 31, 2012

WHEN U DECIDE TO SELL???

Hi All,

I have a good news today, my good fren give angpau this evening. It is a booster for my spirit to provide better daily prediction to the public. Thank You my good fren, may u prosper this year and the next year to come.  May God bless u and your family.

I'm driving from Bintulu to Kuching this morning.  It takes me 9 hours to arrived at Samarahan, Sarawak.  The name of Pan Borneo highway should be limited from Kuching to Sarikei only. Between Sarikei and Bintulu, the Highway  name should be replace by Jalan Kampung.  Potholes, bumpy road is everywhere.  Imagine u drive 280 km through this road.   My body suffer pain every joints.  Worst thing is my wife and 2 children (2 & 3 years) following me.  But the pain disappear when i saw the SEG closing price.  After long waiting, finally SEG up today.  Not so much, only 10 sen up.  Hopefully u gain some money from SEG.

First Things First


SEG chart today (LOOK AT TRIGGER BUY CANDLESTICK)


When u have BB squeeze counter, pls put in your watchlist and look for trigger candlestick. Normally trigger candlestick is a black and white hammer.  Sometimes, inverted hammer (white and black), dragonfly doji or doji.  Yesterday I wrote about SEG, to enter u must queue your price at 1 point up from upper BB.  Today high volume confirmed the break out.


HUAYANG (WHEN TO SELL)

This is the trick that u should look when u see any chart.  Look here...


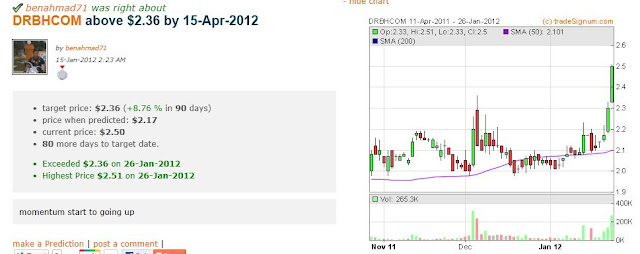
First, u will see 3 gaps in the chart above.  3 gaps tell u price now at high level, u should sell. Second, inverted hammer on top (red colour).  We also call shooting star.  At night, when u see a shooting star, u make a wish like this " I wish tomorrow my counter will going up".  In reality, a shooting star will fall to planets Mars, Jupiter, Pluto or Moon.  So, remember when u see shooting star on chart, don't wish. Take action.    Sometimes u can see 4-5 gaps simultaneously such as DRBHCOM recently (news said target price rm 3). This is different case. That happen when public know price will hit the target and they buy higher price during opening every day.  So, price keep jumping and formed 4-5 gaps. Without seeing indicators, this counter will going down. Next chart

Indicators


From top to bottom, only acc/dist show a significant drop.  3 of them - momentum up, stochastic at max level and MACD histogram green and above 0 line.  Here u can't judge the momentum and MACD, only acc/dist and stoch.  acc/dist now at distribution page. Price going up but acc/dist sees higher peak and lower peak. U must read how to identified accumulation phase and distribution phase.  The best book is Jesse Livermore book.


Happy Trading!!!


Monday, January 30, 2012

FROM BLOGSPOT TO WORDPRESS

Hi All,

I'm a bit busy this week since i now learning to build a better website where i can provide better service and presentation, value added forum, simplified candlestick and chart pattern, rules and regulations, memberships account, setup indicators and many more in order for u to become a better person in stock market. If I still holding to blogspot, i can't put many ideas and can't help many people without the forum.  To do so, i had bought a domain name, subscribe to a  web hosting Dreamhost, pay monthly to website software developer (drag and drop Wordpress) and last thing to do is to develop the website myself.   It may be complete in one month but at the same time, i still put my thought in mypreditioncloud.   Don't worry about how i will manage my time, but now let focus on your trading tomorrow. 

First Things First

SEG

I have wrote about SEG many times.  It maybe test your patient when other counter like DRBHCOM, AZRB, KEURO went up recently.  U see KIMLUN prediction above, that is the way i see SEG now. Watch this....

Chart Orientation
Bollinger Band squeeze and breakout.  Volume increase, white inverted hammer at bottom.  I have projected the target price to 2.15.  Enter price at 1.87, cut loss price at 1.76, target price 1.90, 1.96 and 2.15.
Indicators


From top, 1) acc slightly up.
                 2) momentum spike up.
                 3) stoch at 72%.
                 4) MACD histogram green and MACD near 0 line.

My View

I think price will going up to 1.96 and then retrace for another push.  This forecast related to present stochastic at 72%.  


SEACERA

I wrote about SEACERA before, now time has come for u watch and do analysis. 
Chart Orientation


I saw a triangle pattern have been broke out, doji candlestick at bottom and strong support hold at 59 sen. On chart, we can tell that lower low and lower high have been established.  This is the indication that price will be going up sooner or later. Next chart.

Indicators


From top, 1) acc flat.
                 2) momentum going up
                 3) stochastic at 12%.
                 4) MACD histogram green and MACD above 0 line.

My View

It is the best way to enter when the price still low.  Looking at the stohastic at 12%, is it a good bargain?

Lets Play The Rumours

I got tips from a fren telling me that Sime Darby will make General Offer for E&O at 2.30.  So, dont take it boldly, let see the chart first.   Big picture.


The big picture above dated from Dec 2009 till now.  The highest price at 1.76, present price at 1.70.  Yesterday, price try to reach 1.76 ( short 1.75) before push down to 1.70.  Next chart.

Chart Orientation


I saw a bullish rounded bottom pattern, with a white candlestick  (look like a doji on top which create uncertainty between bullish and bearish).  Volume is significant high and show a good sign to break above 1.76.

Indicators


From top,    1) acc lower on 2nd peak.
                   2) momentum up.
                   3) stoch at 83%
                   4) MACD histogram green and MACD above 0 line
My View

Normally, what happen to rounded bottom is the price could not break the neck line (in this case 1.75-1.76) then retrace below, do another push which u will see as  a small handle (cup and handle pattern).  For final push at neck line, big volume will play the part to break the price at  neck line (1.75-1.76).  Stochastic at 83% & acc. have lower peak, both show the bullish weakness.   Now, if u really want  to buy this counter, wait until the price break 1.76 with volume.  If not break, u better wait and find another counter with less risk.  U always can come back later.

I will go to Kuching, Sarawak tomorrow for 3 days course. If i'm not posting, pls bear with me. Tq. 

Happy Trading!!!


Thursday, January 26, 2012

DRBHCOM, MAS, AEM, LONBISC

Hi All,

U make money today with tech sector? If not, watch these counters.

First Thing First


Target price at rm 3.  Looking at chart, it maybe possible.

MAS

I put my thought about MAS counter before, the price predicted to going up to 1.95, on blog title AIM FOR DMAX 2012.  Let see the chart.

6 Jan 2012


26 Jan 2012  (today)


Since i can't draw a horizontal line as  a resistance, the only one i see is at 1.95.
AEM
AEM is one of the technology counters.  I have trading this counter before, now AEM provide good spot to make some money.  Let see.


Chart Orientation
AEM show symmetrical triangle pattern, on top of that, Bollinger Band squeeze. And one important feature is a gap formed today.  Shooting star candlestick after a gap is normal occasion where u can see almost everyday.  Cut loss at 29.5 sen,enter price at 34 sen, target price at 36 sen and 47.5 sen.
Indicators


From top, 1) acc flat
                 2) momentum up
                 3) stochastic at 19%
                 4) MACD histogram green and MACD above 0 line.

My View

This counter show symmetrical triangle, bollinger band squeeze, a gap, stoch at low level, MACD histogram green and MACD above 0 line, momentum up. With many indicators supporting it, u can't ask for more.


LONBISC

Everybody like biscuits especially  kids.  Price fall to lowest in Oct 2011 in which the same level on Mac 2009.  So price now still i consider low. Look at the chart


Chart Orientation

Long white candlestick break BB at 75 sen today.  It is strong indication price will follow through tomorrow.  Cut loss at 67.5 sen, entering price at 80 sen, projection target price at 88 sen, 99.5 sen and rm 1.02.

Indicators


From top, 1) acc up
                 2) momentum up
                 3) stochastic at 52%
                 4) MACD histogram green and MACD near 0 line.

My View

Not much to say, price still low, long white candlestick and high volume tell all.


Another counter to Watch:

MEGB, KEURO, AZRB, IJM this morning (27/1/2012)


Happy Trading!!!


Wednesday, January 25, 2012

TECH STOCK IN FOCUS

Hi All,

How are u after long weekend during CNY?  Me, as usual stay at home and watch Astro Beyond.  My favorite programs are Discovery Channel and American Chopper + Bikers Build Off + West Coast Customs.  Their technology such as C&C machine is so fantastic, I wish i could have one to customise my bike. 

First thing first,


News

Since we are talking about tech now, let us see the tech sector today.  Big Picture. 


Tech sector rebounded starting from mid September 2011, forming cup and handle pattern at 14.35 point and shoot up to the target resistance 18.02.  If the resistance could not break, maybe will retrace a bit for building up momentum then pushing another round. 

There are few tech counters that I think maybe going up tomorrow such as ENG, GPACKET,GTRONIC and JCY.  Next chart.

ENG


Chart Orientation

Enter price at 1.78, target price at 1.89 and 1.94 and cut loss price at 1.63.  My cut loss point at 1.63 and not at 1.42 because nobody want to stuck near the bottom and at the same time your risk to enter is much more larger than u can chew (i mean compare to reward).  Look carefully, on Jun 2011, price rebound at support 1.63,  then cross below 1.63 on 17 Oct 2011 before cross above the same line on Jan 6, 2012.  Now become strong support, if touch, do not hesitate to sell. Next chart

Indicators


From top, 1) acc up
                 2) momentum up
                 3) stochastic at 84%
                 4) MACD histogram green and MACD above 0 line.
My View
Price will try to close gap at 1.89 to 1.94, fail to do so, price will retrace to 1.63 before rebound again.  Even though stoch at 84%, i believe price will touch 1.89.


GPACKET


Chart Orientation

Bollinger Band Squeeze, entering price at 63 sen, cut loss price at 55 sen and target price at 66.5 sen, 69 sen, 72 sen and 79.5 sen. Bullish was confirmed by white candlestick and volume keep increasing. 

Indicators


From top, 1) acc up
                 2) momentum up
                 3) stochastic at 24%
                 4) MACD histogram green and MACD near 0 line
My View

Enter at low price, cut loss minimal and reward much larger.

GTRONIC


Chart Orientation

Price cross neck line double bottom at 93 sen today.  Now resistance at 93 sen reverse to support line.  Suggested enter price at rm 1 because of strong resistance at 99 sen.  Target price at 1.08 and 1.15.

Indicators


From top, 1) acc up
                 2) momentum up
                 3) stochastic at 74%
                 4) MACD histogram green and MACD above 0 line

My View

If price break resistance at 99 sen,  there is more room to move forward.

JCY


Chart Orientation

Very big cup and handle pattern, likely to be break by tomorrow (26 Jan 2012).  Resistance at 1.26, entering price at 1.27 and target price 1.55 and 1.59. Cut loss price at 1.07.

Indicators


From top, 1) acc climbing
                 2) momentum climbing
                 3) stochastic at 50%
                 4) MACD histogram and MACD above 0 line

My View

Clear as sky, JCY have big handle and cup pattern, long white candle, high volume today, all indicators up especially stoch at 50% meaning more room to play.  All of these indication refer to 1 fact, price will try to break 1.26 tomorrow, your queue should be at 1.27.  So, good luck to u and don't be greedy.


Happy Trading and Happy Chinese New Year!!!

HAPPY WATER DRAGON YEAR 2012


To All Chinese Community and All My Chinese Fren,

Happy Chinese New Year 2012

I wish  this Water Dragon Year bring prosperity, happiness, peace and health to u and your family.  May God bless u all.


Wednesday, January 18, 2012

THURSDAY - PROFIT TAKING DAY OR LOSS TAKING DAY

Hi All,

Hope u will make money on BIMB today. I'm just lucky these days when my prediction performed more than i expected.   I still waiting for KIMLUN to move up and have buy small lots of SEGi.  When buy earlier, I can get the  cheapest and best price, at the same time I'm not following  the crowd.  Watch E&O, doing shooting star today, price will go down tomorrow.

I read  news last week about profit taking day.  But not all traders make money in the stock market but for sure many loss money during trading.  So, the author tell us that profit taking day must also include lost taking day, since force selling by securities or individuals doing cut loss to minimise losses.  So, tomorrow is the profit taking day and also loss taking day. 

SEACERA

Seacera show hammer at bottom, some sort of trigger for buying. Don't buy yet, this is for u to watch only. Until such time, the price cross 20 MA, then look at others indicators for confirmation.


MUHIBAH


Chart Orientation

I saw 2 white candles and i also notice the 2 gaps.  One have been closed during retracement recently but the other one  is not.  As u know, my cut loss point just 1 point below the lower  gap at 1.11.  Entering price at 1.21, 1st resistance at 1.23, 1.30 and 1.36.

Indicators


From top, 1) acc flat.
                 2) momentum climbing.
                 3) stochastic 45%
                 4) MACD Histogram still RED but MACD above 0.

My View

One indicator i like so much now is not in the chart but it help me many times.  So, I hope Muhibbah will going up tomorrow.

YTL

YTL going up yesterday by showing white candlestick just below 20MA during closing. Other than that BB squeeze in the making.    My entering price at 1.50, cut loss at 1.45 and target price at 1.54, 1.61 and 1.72. 

Indicators


From top, 1) acc juat about to move up
                 2) momentum on the move
                 3) stochastic 37%
                 4) MACD green and MACD above 0


My View

All indicators and candlestick + BB support my thinking that this counter about to move up. TQ.


Happy Trading!!!


E&O, KIMLUN AND LANDMARK

Hi All,,

Making money today? If not, look at E&O and KIMLUN tomorrow.  Short brief on   E&O and KIMLUN below.  Another counter i suggest is LANDMARK.  Enjoy your trading.

E & O


Chart Orientation

E&O surge today with MARUBOZU candlestick, cross triple bottom neck line at 1.46. This crossing must be done in  quick manner and with high volume  as u can see at the bottom. I get this info from my fren, Dr Ooi, do counter check from chart, then write up in the blog.  The credit goes to her, who i believe making money for the last 2 weeks and today.  I hope this CNY 2012 bring prosperous and prosperity to her and family.

If u still interested, enter price at 1.53 and hopefully touch resistance at 1.76.  Cut loss point at 18 sen below, 1.36.  Calculate your risk and reward so that u will not stuck as long term investor.  Next chart.

Indicators


From top,  1) acc up
                 2) momentum up
                 3) Stochastic touch 20% line and up.  I consider 42%.
                 4) MACD histogram green and above 0 line.
-  In this case, one indicator stand out from the rest  but i think all indicators above are enough  for u to make decision.

Risk and Reward

Risk      :   ???
Reward  :  ???


U have to calculate yourself.  If not rewarding leave it.  So many counters u can chose, don't stuck with this one. 


My View

All indicators and MARUBOZU candlestick showing price will going up tomorrow.  No doubt about it, unless something that i don't know happen.  My advice is don't follow the crowd.  The good time to buy is when price still stagnant and not rushing to the top.  U can do that yesterday or the day before. 

KIMLUN


Chart Orientation

Today a dragonfly doji  above a gap.  Volume still low.  Entering price, target price and cut loss price as per chart.  Remember, calculate your risk and reward.

Indicators

From top, 1) acc up
                2) momentum up
                3) stochastic above 20% ie 28%
                4) MACD histogram green but MACD below 0

-If the price going up tomorrow, so does the MACD line.

My View

I think price will going up tomorrow because of the gap up.  Don't take my word easily, do some research about it. 

 LANDMARK 

Chart  Orientation

LANDMARK show symmentical triangle.  To ensure success, LANDMARK should break out at 2/3 sym triangle in which i consider tomorrow.  Enter at 1.12, cut loss at 1.06, target price at 1.14, 1.16 and 1.22.  Volume still low.

Indicators


From top,  1) acc up
                 2) momentum up
                 3) stochastic 50%
                 4) MACD histogram green and MACD above 0.


My View

If the price reach the apex, taht is consider fail sym triangle breakout. So the latest must be tomorrow.  If u want to play break out on sym triangle, your enter price should be 1.15, just outside the triangle.  Don't follow herds or crowd.  Enter at early stage, not in the middle or on top of the hill because  Trading is Risky Business, take care your money and u can sleep well every nite. 

Happy Trading!!!

Tuesday, January 17, 2012

SEGi AND WIJAYA

Hi All,

I'm looking at education stocks which have consolidated for a long time.  Education stocks comprise of Help, Masterskill (MEGB), SEGi and so on but i'm only interested with MEGB and SEGi now.

SEG


Chart Orientation

SEGi try to form "Cup and Handle" pattern.  Bollinger Band squeeze and dragon fly doji at bottom.  Cut loss point at 1.76 (correction from chart 1.75), entering price at 1.82, target profit at 1.87 and 1.96. Next chart.

Indicators


From top, 1)  accumulation on top of the hill. Price not move yet,but somebody keep buying.
                 2) momentum on the move.
                 3) stochastic at 57%.
                 4) MACD histogram green and near 0.

Risk and Reward

If enter price at 1.82,

Risk      :     1.82 - 1.76 = 6 sen
Reward :1) 1.87 - 1.82 = 5 sen
               2) 1.96 - 1.82 = 14 sen

My View

SEGi forming strong support base at 1.77, waiting Bollinger Band break out.   Accumulation move very high but price still not move yet, it is what i call divergence. If market against u after u had  enter, cut loss 6 sen is not much, unless u buy in very big  lots. I like SEGi because when it move, u can get more than  10  sen easy. 


WIJAYA

Not much i know about  Wijaya.  But this is the simplest method u can make a decision to buy.  Let see the chart.


Chart Orientation


Every time price drop to 20 MA, price will rebound again.  This repeated many times ie          7 times.  Now  price rebound just above 20MA and seem like a white hammer candlestick. If u want to enter, price at 82 sen and resistance at 85 sen.  Next target should be 88 sen. 

My View

In this case, I dont need other indicators to support my idea.  Price move in uptrend channel (sorry not draw it), rebound at 20 MA and white candlestick.  Other than that,  in early December, Wijaya received approval from its shareholders to buy two companies in Indonesia for US$80 million (RM251.8 million).

The two companies – Wealth Gate Pte Ltd and Suffolk Pte Ltd – have 80,000ha of land in Irian Jaya that have been approved for oil palm plantations and related activities.


Wijaya would first be extracting timber from the forested land, valued at US$1,000 (RM3,147) per hectare, before converting the area into oil palm plantations, Anuar had told Business Times

News


So, first timber, then oil palm plantations, next moneydrop in the both pockets.

Happy Trading!!!


Monday, January 16, 2012

DRBHCOM, BIMB and E & O

Hi All,
Dow Jones drop -49 point.  So remember, when DJ down, normally KLCI will follow.  But, these counters maybe going up tomorrow.  Thanks for Kamal Aziz for providing the long list that need to be scan.   

DRBHCOM

This week Khazanah will decide which parties will be the winner of the PROTON buy out whether Dato Nadzmi or DRBHCOM.  The upper hand most possible with DRBHCOM, which supported by Tun Mahathir and having collaboration with Volkswagon.  I queue last week at 2.17.  Let see the chart.

Chart Orientation


White candlestick protrude and break out upside from BB squeeze.  The trigger candlestick (white hammer at bottom - blue color) on 6 Jan 2012 tell traders this counter will going up soon. On friday, u see the high volume during breakout. My target price as per chart, i don' t draw cut loss point neither entering price.  Why?  Look at My View. Next chart.

Indicators


From top, 1)  accumulation picking up.
                2)  momentum climbing.
                3)  stochastic at 73%.
                4)  MACD Histogram green and at 0.


My View

I have enter DRBHCOM last week after I wrote the title "PROTON - TO BUY OR NOT TO BUY".  It is up to u to buy or not because DRBHCOM have move up +14 sen last friday before closed at 2.17.  If u see the target price, it is quiet rewarding if DRBHCOM win the Proton buyout. So, i have put all necessary information for u to make a decision.


BIMB


Chart Orientation


Last friday, bullish candlestick morning doji star forming, volume increased  drastically.   I draw cut loss line at 1.93,  enter price at 2.04, 1 point above friday highest, and target price cum resistances at 2.1, 2.17 and 2.29.  I believe u will check your resistance before make up your mind.  Next chart.

Indicators


From top, 1) accumulation start moving up.

                 2) momentum still strong upward
                 3) stochastic at 46%
                 4) MACD histogram green and MACD above 0.

Note:  U also can used Moving Averages (MA's) to determine your enter position.

Risk and Reward

Let say u enter at 2.04

Risk       :  2.04 - 1.93 = 9 sen

Reward :  1) 2.10 - 2.04 =  6 sen
                 2) 2.17 - 2.04 = 13 sen
                 3) 2.29 - 2.04 = 25 sen
  
My View

Morning Doji Star candlestick show strong indication of bullish.  Other than that,  stochastic still low and MACD 4Red 1Green (4R1G) and stay above 0.  I also look at other indicators Bollinger Band squeeze which will be happen anytime soon.  Remember BB squeeze will break out  upside or having a break down.


E&O


Chart Orientation

White candlestick cross 20 MA, BB squeeze waiting to breakout.  Volume high on last friday,  entering price suppose at 1.46 but revised to 1.47 when strong resistance at 1.46.  Cut loss price at 1.35.  Next chart.

Indicators


From top,  1) accumulation flat.
                  2) momentum down.
                  3) stochastic at 20%
                  4) MACD histogram green and at 0.


My View

Very weak at momentum and accumulation but good on stochastic and MACD.  Cross 20 MA and waiting for BB breakout.  My thinking this counter will be going up.

I have a few counters that I still think can going up.  Look at TradeSignum. 

Happy Trading!!!