I'm holiday in Kuching for Hari Raya Haji. Yesterday my family and I, booking online from Jan 2010 for AIRASIA aircraft AK 5220 bound for Kuching at 1350 pm. The best part is I'm booking for 3 person (myself, wife (with daughter - 1 year old) and my son) but the AirAsia staff give me separate seat (2 seats at 18 E&F) and 1 seat at 3B. I seat at 3B but my wife and children at 18 E&F. After seating, my son crying and start walking to find me in the front seat. So i have to sit at 18 E&F, 2 seat for 4 person. To make matter worst, my son do not feel comfortable, and move here and there and crying many times. Just before landing, my son vomitted (tak sempat guna bag muntah) at the aircraft floor and this is because AirAsia fail to provide us 3 seats in a rows. So, happy cleaning...

I write this lengthy Dow Theory for me and u to learn something which maybe applicable in our trading situation now. I posted KLCI and Dow chart for comparison. So, take a look.
BOOK : Technical Analysis From A to Z
AUTHOR : Steven B. Achelis
Overview
In 1897, Charles Dow developed 2 broad market averages. The "Industrial Average" included 12 blue-chip stocks and the "Rail Average" was comprised of 20 railroad enterprises. These are now known as the Dow Jones Industrial Average and the Dow Jones Transportation Average.
The Dow Theory resulted from a series of articles published by Charles Dow in the Wall Street Journal between 1900 and 1902. The Dow Theory is the common ancestor to most principles of modern technical analysis.
Interestingly, the theory itself originally focused on using general stock market trends as a barometer for general business conditions. It was not originally intended to forecast stock market. However, subsequent work has focused almost exclusively on this use of the Theory.
Intrepretation
The Dow Theory comprises 6 assumptions:
1. The Averages Discount Everything.
An individual stock's price reflects everything that is known about the security. As new information arrives, market participants quickly disseminate the information and the price adjusts accordingly. Likewise, the market averages discount and reflect everything known by all stock market participants.
2. The Market Is Comprised Of the 3 Trends.
At any given time in the stock market, 3 forces are in effect: Primary trend, Secondary Trend and Minor Trend.
A. Primary Trend
The Primary trend can either be a bullish (rising) market or a bearish (falling) market. The primary trend usually lasts more than one year and may last for several years. If the market is making successive higher lows and higher highs, the trend is up. If the market making successive lower highs and lower lows, the trend is down.
B. Secondary Trend
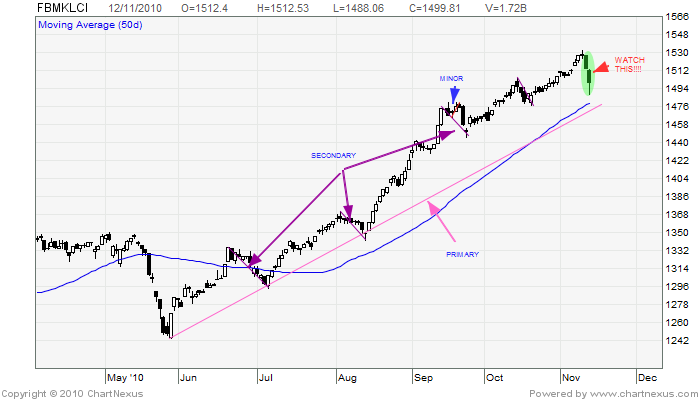
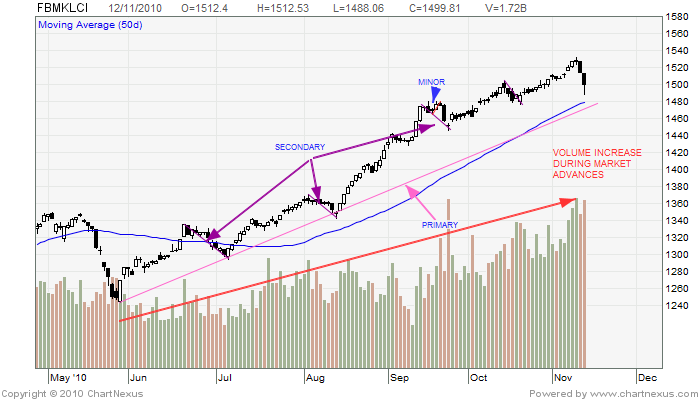
The Secondary trend are intermediate, corrective reactions to the primary trend. These reactions typically last from one to 3 months and retrace from one-third to 2 third of the previous Secondary trend. The following FBMKLCI show Primary trend, Secondary trend and Minor trend.
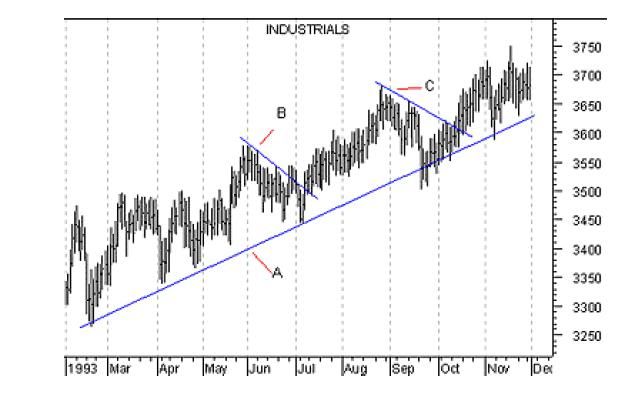
The following chart shows a Primary Trend (line "A") and 2 Secondary Trend (line "B & C").
C. Minor Trend
Minor trends are short term movements lasting from one day to three weeks. Secondary trends are typically comprised of a number of Minor trends. The Dow Theory holds that, since stock prices over the short-term are subject to some degree of manipulation (Primary and Secondary trends are not), Minor trends are unimportant and can be misleading.
3. Primary Trend Have 3 Phases
A. The First Phase.
The Dow Theory says that the First phase is made up of aggressive buying by informed investors in anticipation of economic recovery and long term growth. The general feeling among most investors during this phase is one of "gloom and doom" and "disgust". The informed investors, realizing that a turnaround is inevitable, aggresively buy from these distressed sellers.
B. The Second Phase.
The Second Phase is characterized by increasing corporate earnings and improved economic conditions. Investors will begin to accumulate stock as conditions improve.
C. The Third Phase.
The Third Phase is characterized by record corporate earnings and peak economic conditions. The general public (having had enough time to forget about their last "scathing") now feels confortable participating in the stock market- fully convinced that the stock market is headed for the moon. They now buy even more stock, creating a buying frenzy. It is during this phase that those few investors who did the aggresive buying during the First Phase begin to liquidate their holdings in anticipation of a downturn.
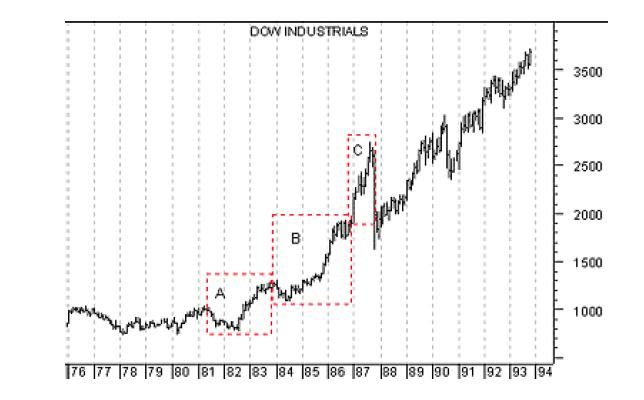
The following chart of the Dow industrials illustrates these 3 phases during the years leading up to the October 1987 crash.
In anticipation of a recovery from the recession, informed investors began to accumulate stock during the First Phase (box A). A steady stream of improved earnings report came in during the Second Phase (box B), causing more investors to buy stock. Euphoria set in during the Third Phase (box C), as general public began to aggresively buy stock.
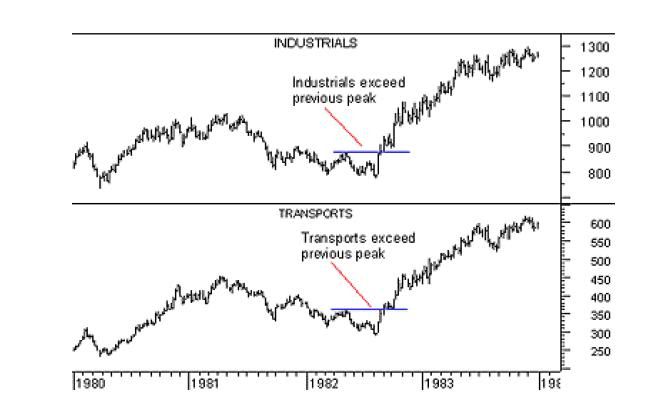
4. The Averages Must Confirm Each Other
The Industrials and Transports must confirm each other in order for a valid chang of trend to occur. Both averages must extend beyond their previous secondary peak (or trough) in order for a change of trend to be confirmed.
The following chart shows the Dow Industrials and the Dow Transports at the beginning of the bull market in 1982.
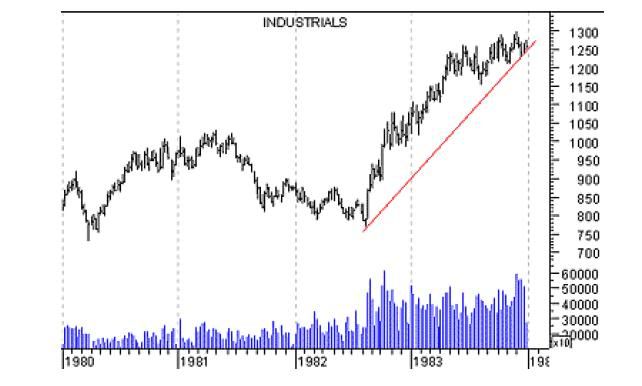
5. The Volume Confirms The Trend
The Dow Theory focuses primarily on price action. Volume is only used to confirm uncertain situations.
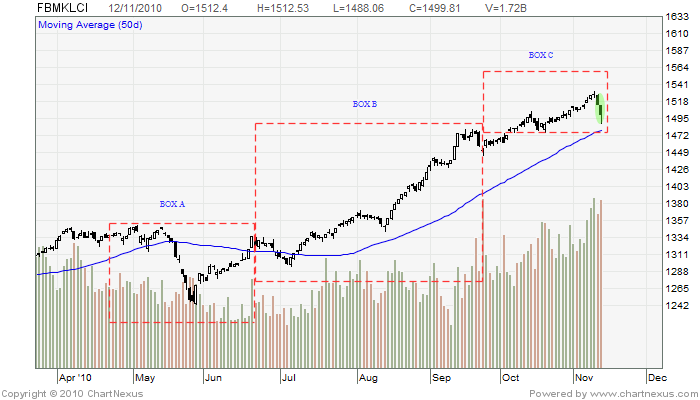
Volume should expand in the direction of the primary trend. If the primary trend is down, volume should increase during market declines. If the primary trend is up, volume should increase during market advances.
The following chart shows expanding volume during an uptrend, confirming the Primary Trend.
6. A Trend Remains Intact Until It Gives A Definite Reversal Signal
An uptrend is defined by as series of higher low and higher high. In order for an uptrend to reverse, prices must have at least one lower high and one lower low.
When a reversal in the primary trend is signaled by both the Industrials and Transports, the odds of the new trend continuing are at their greatest. However, the longer a trend continues, the odds of the trend remaining intact become progressively smaller.
Note: Tomorrow (Monday - 15/11/2010) pls watch TCHONG, TGOFFS, SEG and KKB.
No comments:
Post a Comment