For Indian community, wishing u a Happy Deepavali.
I always use Acc/dist as the first indicator in my prediction. If Acc/dist not good, i just leave it behind. So i look at a counter when acc/dis surge only. For your guide line, i bring the best from DR ALEXANDER ELDER from his book TRADING FOR A LIVING.
Page 175
"This indicator was developed by Larry Williams and described in his 1972 book, How I Made A Million Dollars. It was designed as a leading indicator for stocks, but several analysts have applied it to futures. The unique feature of Acc/dist is that it tracks the relationship between opening and closing prices, along with volume.
If prices close higher than they opened, then bulls won the day and Acc/dist is positive. If prices close lower then they opened, then the bears won and Acc/dist is negative. If prices close where they opened, then nobody won and Acc/dist is zero. A running total of each day's Acc/dist creates a cumulative Acc/dist indicator.
Acc/dist credits bulls or bears with only a fraction of each day's volume. That fraction depends on the day's range and the distance from opening to closing price. The greater the spread between opening and closing price relative to daily range, the greater the change in Acc/dist.
Acc/Dist = Close-open X Volume
High - LowFor example, if the distance from today's high to low is 5 points but the distance from the open to the close is 2 points, then only 2/5 of today's volume is credited to the winning camp.The pattern of Acc/dist highs and lows is more important than its absolute level, which depends on the starting date.
Crowd Behaviour
Opening and closing prices are among the most prices of the day. The opening price reflects all the pressures that have gathered while the market was closed. Opening are often dominated by amateurs who read their newspapers in the evening and trade in the morning.
Professional traders are active throughout the day. They often trade against the amateurs. Ad the day goes on, waves of buying and selling by amateurs and slow-moving institutions gradually subside. Professionals usually dominate the markets at closing time. Closing prices are especially important because the settlement of trading accounts depends on them.
Acc/dist tracks the outcomes of daily battles between amateurs and professionals. It ticks up when prices close higher than they opened - when professionals are more bullish than amateurs. It ticks down when prices close lower than they opened - when professionals are more bearish than amateurs. It pays to bet with the professionals and against the amateurs. "
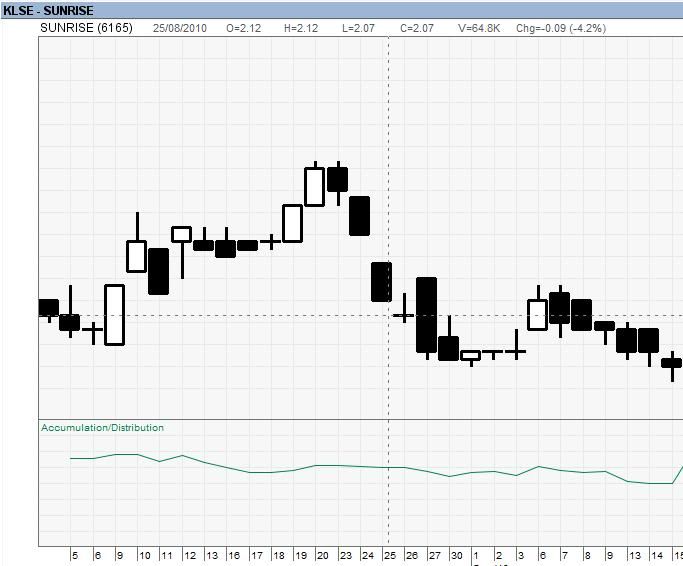
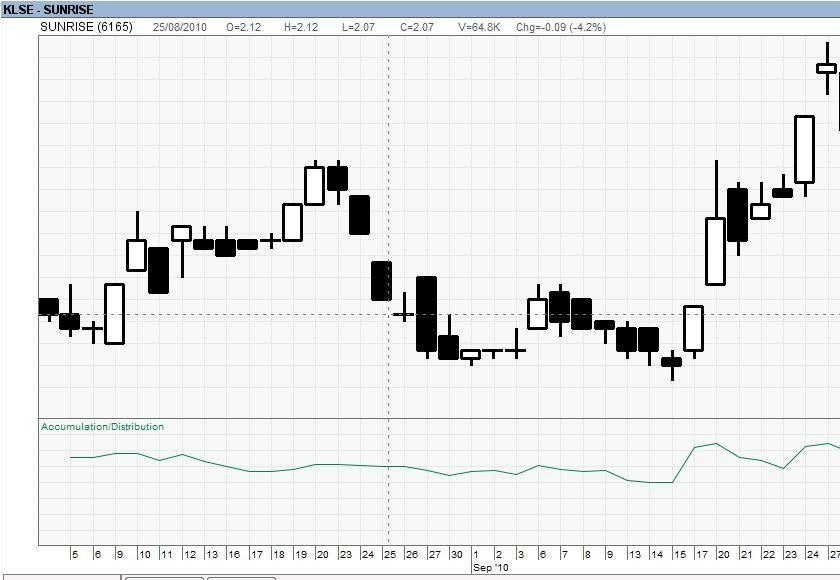
As an example, i watch SUNRISE Acc/dist surge before the price jump.
SUNRISE (14/9/2010)
SUNRISE (27/9/2010)
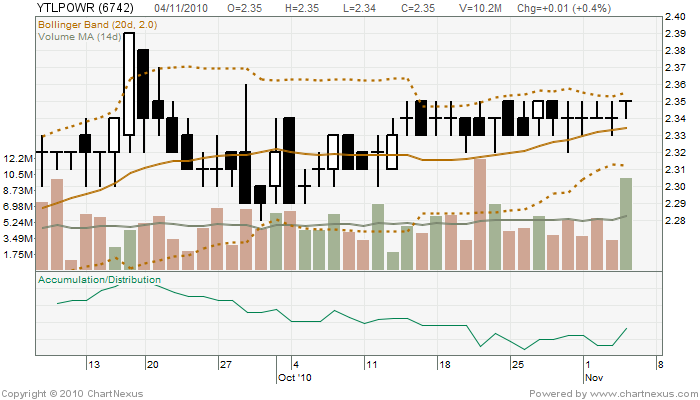
For next week, watch YTLPOWER, waiting for breakout from bollinger band, acc/dist surge today, strong resistance for 16 days at 2.35. Good luck.
thanks for sharing on accumulation and distribution indicator! Getting very busy now on my studies, will surely look back at it when i am free! Learning a lot from ur blog bro! :D
ReplyDeleteHi Tan,
ReplyDeleteThe beauty of Acc/dist is it include volume in the calculation, and it always going up first before price moved.TQ