Showing posts with label Counter Prediction. Show all posts

Saturday, February 18, 2012

MY ANSWER FOR A GUY NAME MR SELL STRUCTURED SETTLEMENT

Hi All,

I have to answer Mr Sell Structured Settlement comment on my blog title How Much U Gain In One Month as per  below:

There are so many people saying I've gained 15,20 pounds of muscle this month or similar. Also various books that claim they reveal the secrets of working out and to gaining muscle mass fast, that promise crazy gains. So I'm wondering, how much muscle could you really gain in a month (without juice) . I mean most people gain 15-20 pounds of muscle per year. If a person could gain 20 pounds in a month that in 5 months he'll be 100 pounds (of muscle) heavier,looking like Coleman. I doubt you can gain that much even with juice, it's ridicioulous!

I can refused to publish his comment on my blog but that does not solve the problem.  There are many more questions will be coming if i'm not answer his question. So, let me answer through my last 6 posts.  This will be the longest post that will take many hours to complete.  Lets start post by post.

SOMETHING HIDDEN ON PROTON - MY THEORY - SUNDAY 12 FEB  2012
This post I talk about a theory where I think Proton is waiting something to push price higher.  I list the news, put some picture of CFE, as usual chart and indicators.  To show u how u should listen carefully, i bring u the new chart and indicators today. 
PROTON
Chart on 12 Feb 2012

Price maintain above support at 5.40 for about 1 month, today up +3 sen.  Other than that, maintain well above 20ma support.  U see Bollinger Band squeeze now and waiting to break out.  Stochastic up.  Need i tell u more?  If price break upper Bollinger Band at 5.53, there is good start for u to enter.

SENDAI, MBSB AND PMETAL  - SUNDAY 12 FEB  2012 
These are counters that i predicted will be moving up.  Out of 3, only PMETAL  which is  "lambat panas". 

SENDAI
 Chart on 12 Feb  2012


Chart  today 17 Feb  2012
Look at 13 Feb 2012 (red arrow)


Blue arrow = 12 Feb  2012
Red arrow = next day up. 13 Feb 2012 
How much u gain after 1 day prediction:  1.73 -1.59 =  +14 sen

MBSB
Chart on 12 Feb  2012


Chart today  on 17 Feb  2012
Look at 13 Feb  2012  (red arrow)


How much u gain after 1 day prediction?? 2.39 - 2.23 = +16 sen
One thing for sure, MBSB now drop at 20 ma support. If not break 20ma, price will going up again.  That why i put blue arrow for u to know there are many lower low and lower high during uptrend on chart.  Someone says " TREND IS YOUR FRIEND".  How about u Mr SELL??

PMETAL
Chart  on 12 Feb  2012


I said PMETAL will going up soon.  Lets see the chart below
Chart today 17 Feb 2012

Today PMETAL up + 7 sen with long white candlestick, very closed to 20ma. It takes 5 days for price to going up and closed near 20ma.  See the stochastic?  What will will happen on next Monday? U just have to be patient.

DRBHCOM - ONE SECOND LOOK  13 FEB  2012
Chart on 13 Feb  2012


I said price will going down until touching 20ma.  Lets see the chart..
Chart today  17 Feb 2012


Can u tell me what will happen to DRBHCOM later if u look into Accumulation/Distribution line now?

SMARTAG, CBSA, YTL AND LMCEMNT  TUESDAY FEB 14, 2012

SMARTAG
Chart on 13 Feb  2012


My enter price at 26.5 sen, cut loss price at 25 sen.
Chart today 17 Feb 2012


Well supported at 26 sen, still above cut loss point, 25 sen.

CBSA
Chart 13 Feb  2012


Cut loss point at 38.5 sen

Chart today 17 Feb 2012


red arrow = date of prediction (13 Feb 2012)
blue arrow = today price (17 Feb 2012)

Still above cut loss point.  Break 20ma resistance, u know what will happen next??

YTL

Chart 13 Feb  2012


Cut loss point at 1.45 sen

Chart today


Price still above cut loss point, 1.45.
LMCEMNT

I will cover on the next post.

WHAT HAPPEN TODAY - 14 FEB 2012

This title i cover what happen to yesterday counters.  The one I'm not touch is LMCEMNT.

LMCEMNT

Chart on Feb 13, 2012


I'm talking about LMCEMNT in the trading range channel and after that uptrend channel. I put 7.05 as entering price.

Chart Today


Red arrow is the date of my prediction (13 Feb 2012) when price at 7.05.  Blue arrow is the price on closing today, highest reach 7.22.  So,..
How much u gain??  7.22-7.05 = +17 sen.

If u look at doji candlestick on top now, possibilities for price will going down is higher. 

YINSON
Chart on 14 Feb 2012


Entering price at 1.27.

Chart today 17 Feb 2012


Today up 3 sen and closing at 1.29.  U have added  +2 sen to your account.  U want a good news?  Stochastic still below 20%. 

HOW MUCH U GAIN IN ONE MONTH?  - 16 FEB 2012

The last counter i predict in this title is NAGAMAS.
NAGAMAS
Chart on 15 Feb 2012


Chart today 17 Feb 2012

blue arrow = 17 Feb 2012
red arrow = 15 Feb 2012

Nagamas reached highest price,  75 sen on 16 Feb 2012.


CONCLUSION
From all the counters that i listed, only 2 i consider fail for now ie YTL and NAGAMAS.  Other counters whether they give more than 10 sen up or still waiting to go up.  So,.... this is my prediction, i take all the credit for what i have written in my blog. 
It is up to u, Mr Sell Structured Settlement to read what i can offer u for FREE or just ignore my prediction.  I believe, this writing will not continue for a long long time.  One day I will have to stop writing. Tq

Friday, November 5, 2010

ACCUMULATION/DISTRIBUTION - MY FAVOURITE INDICATOR

Salam Sejahtera and Good Evening,

For Indian community, wishing u a Happy Deepavali.

I always use Acc/dist as the first indicator in my prediction.  If Acc/dist not good, i just leave it behind.  So i look at a counter when acc/dis surge only.  For your guide line, i bring the best from DR ALEXANDER ELDER from his book TRADING FOR A LIVING.  

Page 175

"This indicator was developed by Larry Williams and described in his 1972 book, How I Made A Million Dollars.  It was designed as a leading indicator for stocks, but several analysts have applied it to futures.  The unique feature of Acc/dist is that it tracks the relationship between opening and closing prices, along with volume.

If prices close higher than they opened, then bulls won the day and Acc/dist is positive.  If prices close lower then they opened, then the bears won and Acc/dist is negative.  If prices close where they opened, then nobody won and Acc/dist is zero.  A running total of each day's Acc/dist creates a cumulative Acc/dist indicator.

Acc/dist credits bulls or bears with only a fraction of each day's volume. That fraction depends on the day's range and the distance from opening to closing price.  The greater the spread between opening and closing price relative to daily range, the greater the change in Acc/dist.

Acc/Dist = Close-open    X   Volume
              High - Low


For example, if the distance from today's high to low is 5 points but the distance from the open to the close is 2 points, then only 2/5 of today's volume is credited to the winning camp.The pattern of Acc/dist highs and lows is more important than its absolute level, which depends on the starting date.

Crowd Behaviour

Opening and closing prices are among the most prices of the day.  The opening price reflects all the pressures that have gathered while the market was closed.  Opening are often dominated by amateurs who read their newspapers in the evening and trade in the morning. 

Professional traders are active throughout the day.  They often trade against the amateurs.  Ad the day goes on, waves of buying and selling by amateurs and slow-moving institutions gradually subside.  Professionals usually dominate the markets at closing time.  Closing prices are especially important because the settlement of trading accounts depends on them.

Acc/dist tracks the outcomes of daily battles between amateurs and professionals.  It ticks up when prices close higher than they opened - when professionals are more bullish than amateurs.  It ticks down when prices close lower than they opened -  when professionals are more bearish than amateurs.  It pays to bet with the professionals  and against the amateurs. "

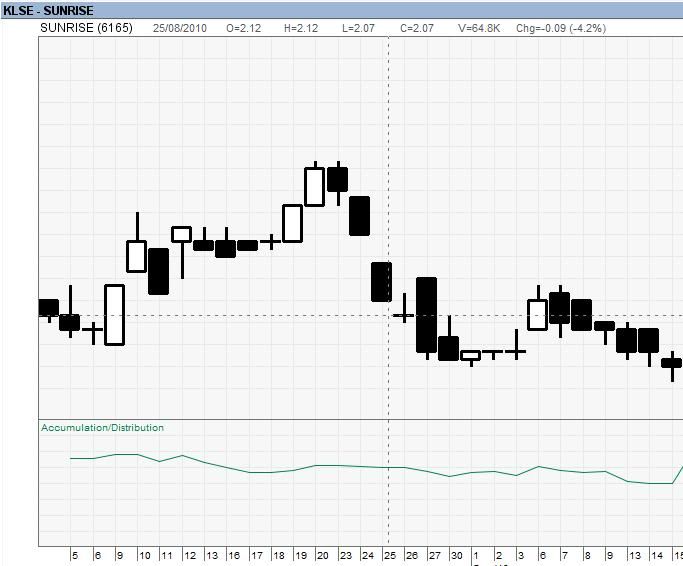
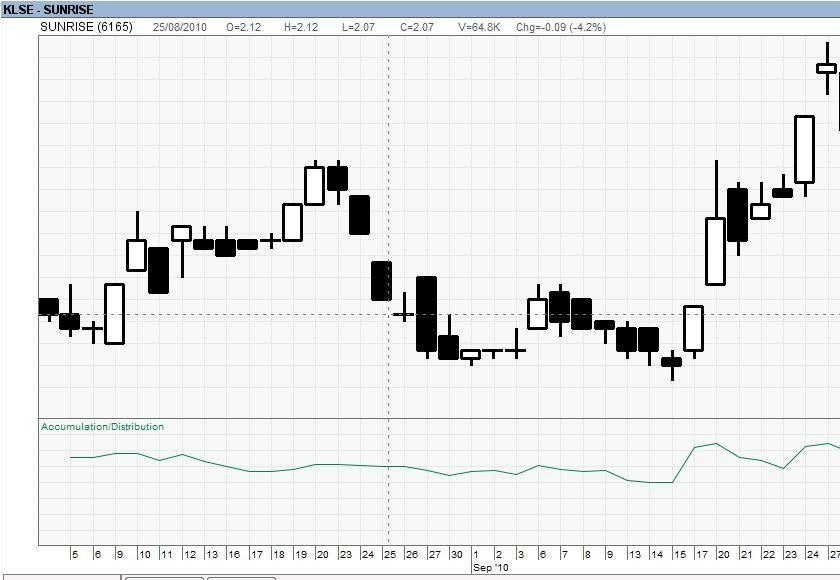
As an example, i watch SUNRISE Acc/dist surge before the price jump.

SUNRISE (14/9/2010)


SUNRISE (27/9/2010)


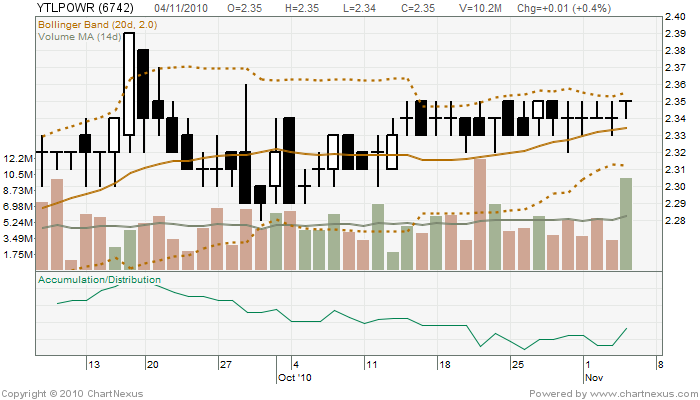
For next week, watch YTLPOWER, waiting for breakout from bollinger band, acc/dist surge today, strong resistance for 16 days at 2.35.  Good luck.


Saturday, October 9, 2010

GAMUDA - MY DREAM FOR MRT (LRT)

Hi All,

I have been dreaming about having LRT which will have connection from KL to Damansara to Puchong to Kajang/Bangi area.  So i put a comment in Tun Mahathir website (http://www.chedet.co.cc/) on 25 Nov 2009.  U can read below.

For checking the originality idea:

1. open http://www.chedet.co.cc/
2. click on Oct 2009
3. open page Buses For Rapid KL
4. Look at comment no.2.


This is so amazing that after i put my thought, somebody copy my idea, do possibility study in 9 months (Nov 2009 - July 2010) then come out with the proposal for MRT project that amounted to RM 36 billion (full project at a cost of RM 50 billion)  without consent that this is my idea that i write it in 4.32 am on 25 Nov 2009.  I believe my idea is valued at RM 10 millions.  It is small money compare to RM 50 billions that GAMUDA/MMCCORP proposed.

Saturday, July 24, 2010, 01.34 AM

Below is the news by NST that cover the MRT Project.  Read my comment on chedet website and the news by NST.  And u will know why im so interested with GAMUDA, MMCCORP and KIMLUN. TQ.

RM30b MRT PLAN
2010/06/08
By Kang Siew Li and Jeeva Arulampalam
news@nst.com.my


KUALA LUMPUR: A special task force has been set up within the Cabinet Committee on Public Transport to study a proposal for a new three-line mass rapid transit
(MRT) system costing more than RM30 billion.

Sources told the New Straits Times that Gamuda Bhd and MMC Corp Bhd had submitted a joint proposal to the government for a new MRT system to improve public transport in the Klang Valley.

While it aims to integrate the monorail and light rail transit (LRT) systems, the MRT lines will also connect the northwest and southeast of the Klang Valley.

The committee is chaired by Prime Minister Datuk Seri Najib Razak.

It is understood that one of the lines will run through Sungai Buloh, Kota Damansara, Kuala Lumpur and Cheras until Kajang. Another line will connect Sungai Buloh, Kepong, Kuala Lumpur and Serdang. The third line will loop around
{};
believed that Malaysian Resources Corp Bhd may have to redesign an upcoming development to facilitate this MRT line.

“The MRT lines will be mostly underground with stops every 500m to 1km in high-traffic areas like the Golden Triangle in Kuala Lumpur. The concept is similar to the MRT systems in Hong Kong and Singapore,” said a source


PREDICTION

GAMUDA

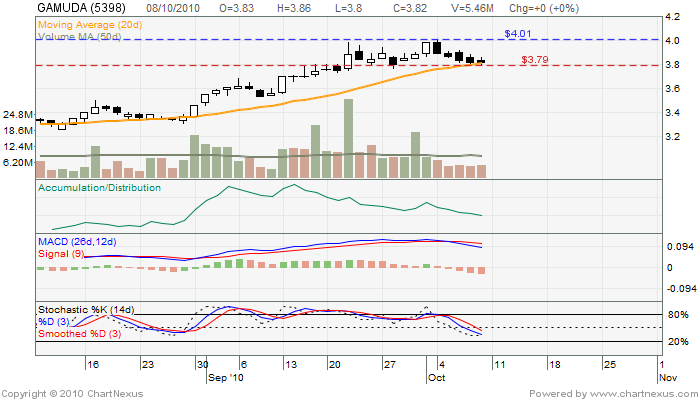
There is no indication for confirm rebound of GAMUDA except it is trading at 20ma support and forming of doji candlestick.  It is wise to wait for tuesday before u trading.  Another thing is 15 Oct 2010, budget 2011 will be presented by PM, so watch carefully on Monday.   


MMCCORP

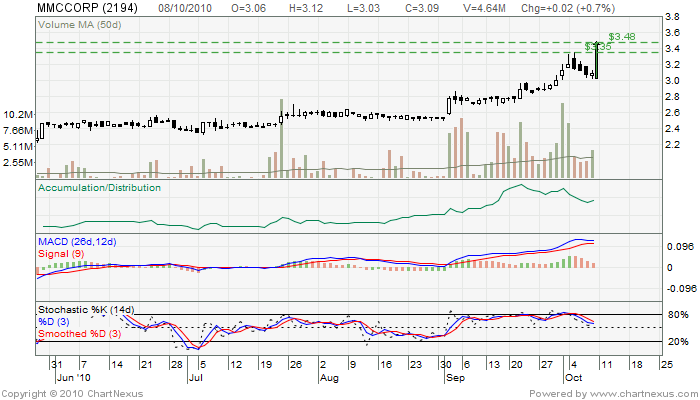
White doji candlestick at 20ma support, vol 50ma high, stochastic presentable, momentum good, acc/dist about to going up, the only problem is MACD histogram still red.  So, if up 10 sen on monday, i figure that u can bet it.  Stop loss should be handy in case u need it. 


KIMLUN

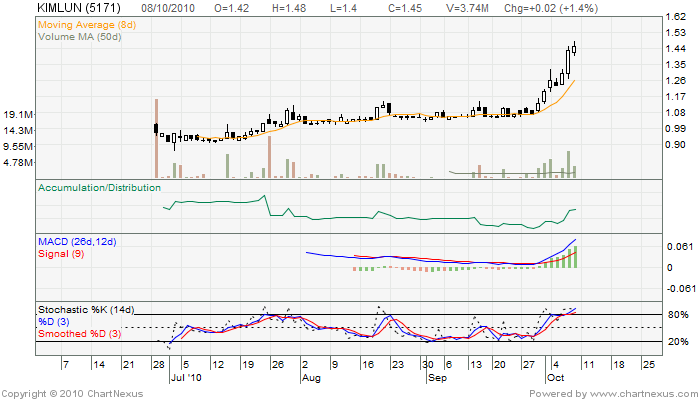
My advice for u, KIMLUN have charted new historical high, MACD green for so many days, stochastic at oversold, momentum also high.  A bit risky if u want to trade on monday or tuesday since crowd definitely will take profit on KIMLUN and put it in GAMUDA or MMCCORP.  Look here..


Thursday, October 7, 2010

MUDAJAYA (7/10/2010)

Hi Guys,


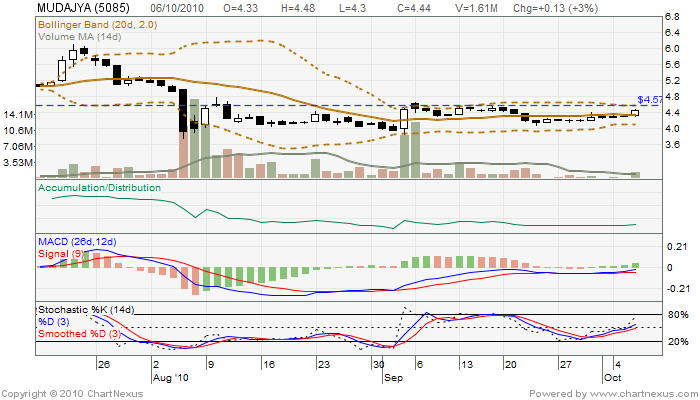
I look at MUDAJAYA, yesterday move up higher and bollinger band squeeze.  If today breakout bollinger band at 4.57, next resistance at 4.98 and 5.22. Enjoy.

Friday, October 1, 2010

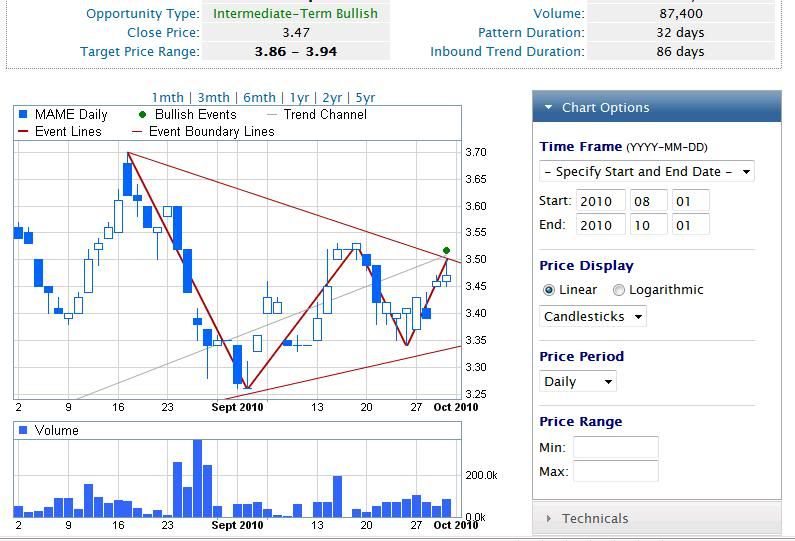
MAMEE - LOOK YUMMY

Hi All,


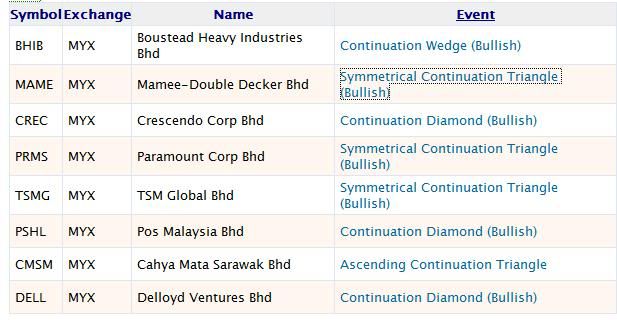
Do u like Mamee? I do.  Today morning, Mamee up 10 sen, and breakout from symmetrical continuation triangle pattern.  I'm using software Recognia, so everyday after 12.01 pm, i'm able to update for the next counter to rebound.  This software have intelligence drawing facilities, autonomous and able to select the parameters or strategies that suit u.  Below, Mamee chart with possible going further for the next monday courtesy of Recognia.  


Monday, September 13, 2010

MUDAJAYA - INDIA IPP

Hi All,

My take today is MUDAJAYA.  This company have been submitted her statement for India IPP (Independent Power Producer) to SC.  As after raya progress, MUDAJAYA show potential profit as per my drawing chart.  Feel free to analyse and make your decision.  TQ